Activity Dashboard
This article summarizes the features of the Activity Dashboard under the Analytics
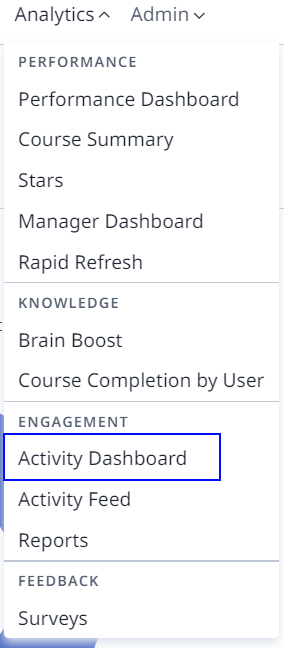
The Activity Dashboard is found under the Engagement section of the Analytics in the Admin Portal.
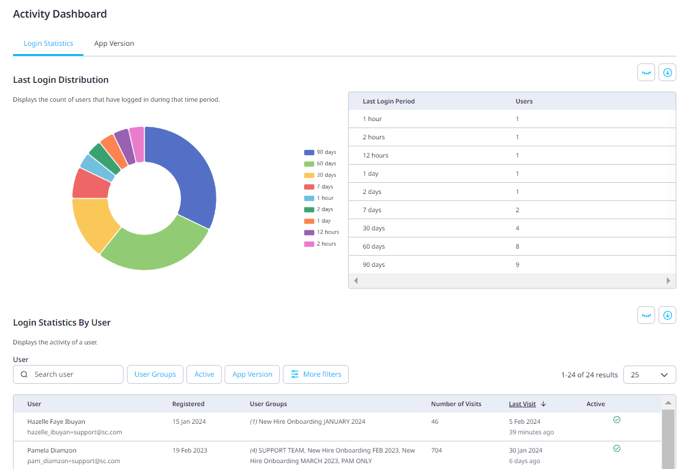
The Activity Dashboard shows an overview of the Login Statistics and the App Version that the users are on.
Reminder: To be included in this report a User must not have any Roles & Permissions that exclude them from the Analytics, such as the Reviewer role.
Login Statistics
What the Report Shows
| Who has logged in to your account | This report summarises who has logged in to the account. This is especially useful for those Admins who have used the bulk upload of users method to invite users to the platform or email invitations. |
| When did a User register and log in to their account | The report will tell you the date the users were registered and the most recent date they logged in. If a user is on this report but does not have a login date then this is because they have been registered but are yet to log in. |
| How many times a user has logged in | The report also highlights how many visits a user has to the platform. This can be useful for the Admin if they want to reward dedicated learners or if they want an overview of user learning habits. |
| Who is an active user | Admins can see the last login dates for all learners, as well as if the learner is an active user. An active user is a user who has logged in to the platform in the last 30 days. |
Filters
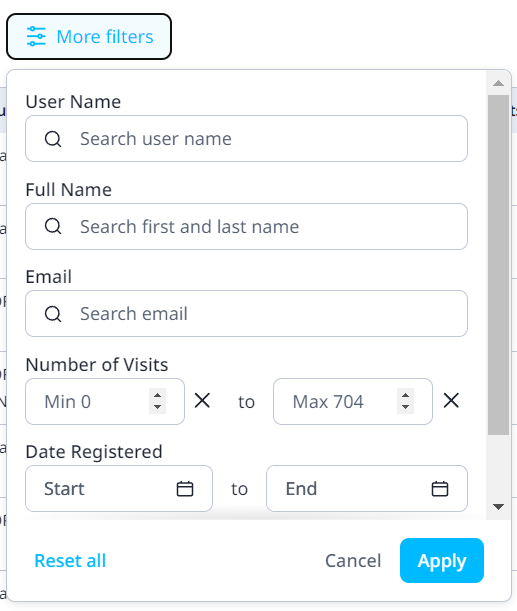
You can filter by User, User Groups, and Active Users via the shortcut filters at the top of the page. Click on the Filters button to access additional filters.

Filter Dropdown
You can filter by additional user properties, number of visits, date registered, date visited and App version.
|
Filter |
Description |
Location |
|---|---|---|
|
User |
Text filter on the user name of the learner |
Toolbar |
|
User Groups |
Multi-select filter on a learners user group (includes hierarchy) |
Toolbar |
|
Active* |
Filters learners that have visited in the last 30 days |
Dropdown |
|
User Name |
Text filter on a learner's User Name |
Dropdown |
|
Full Name |
Text filter on a learner's Full Name |
Dropdown |
|
|
Text filter on the learner's Email |
Dropdown |
|
Number of Visits* |
Number range filter on the total number of learner visits |
Dropdown |
|
Date Registered |
Date range filter on the learner creation date |
Dropdown |
|
Date Visited |
Date range filter on the learner visits This filter affects how some data fields are calculated e.g. the number of visits will reflect the number of visits between the filtered dates |
Dropdown |
|
App Version |
Multi-select filter on the app version from the most recent visit |
Dropdown |
Columns
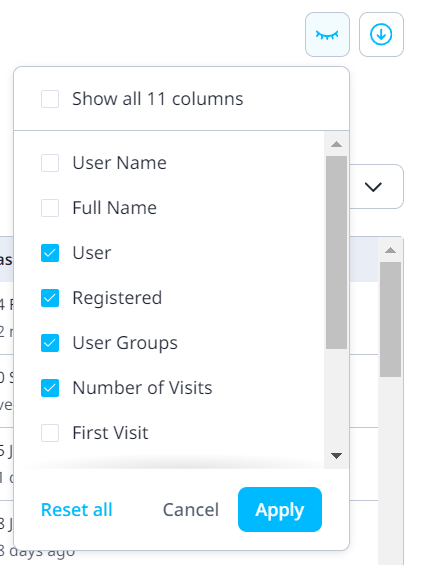
You can choose which of your users' data you would like to see on the page and export as CSV. Only the selected will be included in the export.
|
Column Name |
Description |
||
|---|---|---|---|
|
User Id |
Unique identifier for a learner |
||
|
User Name |
User name of the learner |
||
|
Registered |
Date the user was created in the system |
||
|
Full Name |
The first name and last name of the learner separated with a space character Appears underneath User Name on the screen |
||
|
|
Email address of the learner |
||
|
User Groups |
Directly assigned user groups that a learner is a member of |
||
|
Number of Visits* |
Total number of visits for a learner |
||
|
Last Visit* |
The most recent visit for a learner |
||
|
Active* |
Indicates if a learner has visited in the last 30 days |
||
|
App Version |
The current app version used by the learner |
Export
This allows you to export the report with the current filter columns applied to a CSV file. The export is not limited by the selected page size.
App Version
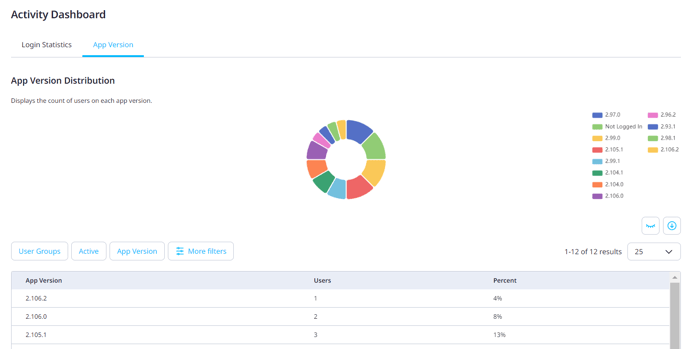
The frequency of app usage helps Admins understand how often users are on the app and complete their learning program. Admins can identify whether users have formed their habit of learning and whether there needs to be more done to encourage this habit. This could be increasing the daily star reward or making shorter lessons to make use of micro-moments. It also allows Admins to see an overview of the frequency to facilitate a quick reporting update.
The version of the app that users are on is also a key element to highlight, as users with an older version of the app won’t be able to access newly released features or improvements to the platform. Learners must update their apps when a new version is released to keep on track with their learning program. If a large percentage of users are on an old version of the app, then it is very likely that many of these users haven't logged in for a long time. This would mean it is time to re-engage these users to complete their courseware.