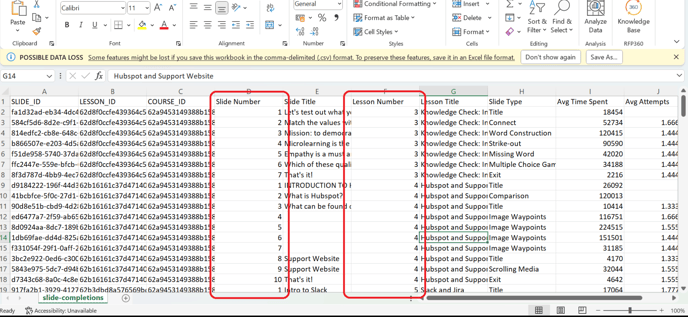
Export with Slide Level Data / Slide Data Display
The data visualization and ability to drill down will support admins to identify ways to improve engagement and completions.
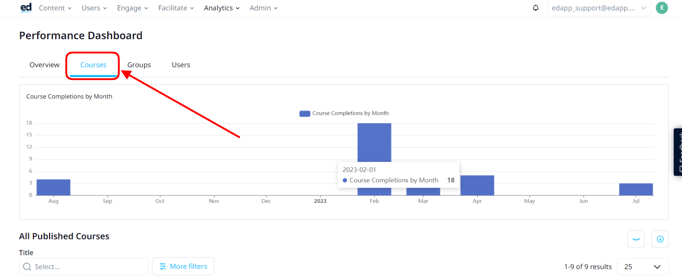
Where to Find the Performance Dashboard
Admins can find the performance dashboard in the Performance section of the analytics menu.
There is an approximate 30-minute data delay for this dashboard.
Functionality Overview
The dashboard will have four tabs: Overview, Courses, Groups, and Users.
Data Drill Down
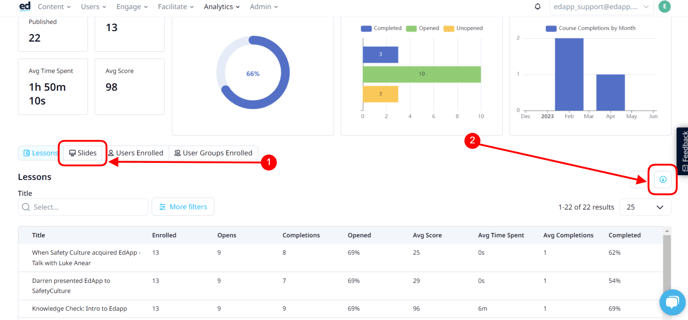
Click on the course/groups/user title to see further detailed data.
The dashboard provides many filters for admins to pick the data to show.
-
Time filter: checking the data in a particular timeframe e.g. 1d, 1w, 1m, 1y, 5y, to check app visits/completions/courses published in the selected timeframe
-
Search filter: to isolate data of a particular user group/course/users
-
Is active - only shows active user data (you can use 'true' to look at those who are active and 'false' for those who are inactive - active user means they have logged in in the last 30 days)
-
Is mandatory - only shows the mandatory courses for compliance purposes
Export
Go to the Performance Dashboard, and browse the data you want to export. Once you find it, there should be an 'Export Button' ![]() on the specific tab you want to download.
on the specific tab you want to download.
Once you click the export button, the file will be downloaded as a .csv file.
Published Date: The date the course was last published. By default, it shows the created date if there is no published date.
Export with Slide Level Data / Slide Data Display
You can export data where a Slide Number and a Lesson Number show. This enables a simple, accurate ordering and linking of slide data within lessons.
1. Click the Courses tab > Select the preferred course under All Published Courses where you want to export the data from.
2. Click Slides > Click the export button on the right part of the Lessons.
3. Open the CSV file you exported, and it will show you the data for the "Slide Number" and "Lesson Number."
All Data Points in the Performance Dashboard
Courses
The Performance Dashboard shows completion data for courses and lessons that are published and assigned to at least one learner. Archived courses are not displayed.
Where a course has a linked translated version, completion data for translated versions will be aggregated under the original course.
Users
For a user to appear in the Performance Dashboard, they must have the Learner role and they must not belong to the Excluded from Analytics or Reviewer roles. Archived users do not appear in the Performance Dashboard. Only the learner's currently assigned courseware will be visible in the Dashboard.
Overview Tab Data Points
Displays an overview of the data in the whole account
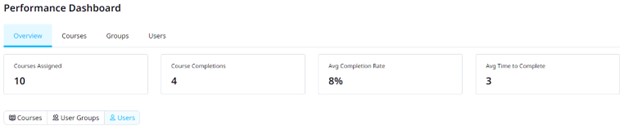
- Courses Assigned: Total number of courses with at least one learner assigned
-
Course Completions: The number of courses completed by currently assigned learners
-
Average Completion Rate: The average of the course completion rate across all courses and learners
-
Average Time To Complete: Average number of minutes spent by learners in successful lesson attempts, only considering the courses completed by a learner
Highest and Lowest Performing Courses
| Columns | Definition | Availability |
| Sort Order |
Rank number based on highest/lowest completion rate followed by the highest/lowest number of completions - (Export) |
Export |
| Course Id |
Unique identifier for a course |
Export |
| Title | The name you gave the course | Both |
| Completions |
The number of currently assigned learners who have completed the course |
Both |
| Completion Rate |
The percentage of currently assigned learners who have completed the course |
Both |
Highest and Lowest Performing User Groups
| Columns | Definition | Availability |
| Sort Order |
Rank number based on highest/lowest completion rate followed by the highest/lowest average score and then by the highest/lowest users |
Export |
| User Group Id |
Unique identifier for a user group |
Export |
| User Group (Name) |
The name of the user group |
Both |
| Avg Score |
The average course score achieved by learners who have completed the course and are currently a member of the user group |
Both |
| Users |
The number of learners currently a member of the user group |
Both |
| Completion Rate |
The percentage of current courseware that is a member of the user group that has been completed by learners currently a member of the user group |
Both |
Highest and Lowest Performing Users
| Columns | Definition | Availability |
| Sort Order |
Rank number based on highest/lowest completion rate followed by the highest/lowest average score |
Export |
| User Id |
Unique identifier for a user |
Export |
| User |
Full name if available otherwise user name |
Both |
| Avg Score |
The average course score achieved by the learner across all currently accessible and completed courses |
Both |
| Completions |
The number of accessible courses that are completed by the learner |
Both |
| Completion Rate |
The percentage of accessible courses that are completed by the learner |
Both |
Courses Tab Data Points
This tab gives the ability to see course progress for assigned user groups. Clicking on the course name shows a lessons table which can be clicked on for more detail.
| Data Point | Definition | Availability |
|
Course completions by month |
||
|
Number of course completions grouped by date (latest course completion per learner) |
Dashboard |
|
|
All published courses - Course Aggregate Data |
||
| Course ID |
Unique identifier for a course |
Export |
| Title |
The title of the course |
Both |
| Average Progress |
Average percentage of mandatory lessons completed in the course across learners enrolled in the course |
Both |
| Enrolled |
The number of learners who are currently enrolled in the course |
Both |
| Unopened |
The percentage of enrolled learners who have not opened the course |
Both |
| Avg Time Spent |
Average minutes spent in the course by currently enrolled learners who have completed at least 1 mandatory lesson |
Both |
| Avg Score |
The average course score achieved by learners who have completed the course |
Both |
| Lessons |
The number of published, non-archived lessons in the course |
Both |
| Mandatory Lessons |
The number of mandatory, published, non-archived lessons in the course |
Both |
| Completed | Percentage of currently assigned learners who have completed the course | Both |
| Course Drill Down Data | ||
|
Lessons Published |
The number of published, non-archived lessons in the course |
Dashboard |
|
Enrolled |
The number of learners who are currently enrolled in the course |
Dashboard |
|
Average Time Spent |
Average minutes spent in the course by currently enrolled learners who have completed at least 1 mandatory lesson |
Dashboard |
|
Average Score |
The average course score achieved by learners who have completed the course |
Dashboard |
|
Average Course Progress |
Average percentage of mandatory lessons completed in the course across learners enrolled in the course |
Dashboard |
|
Completion Status |
The number of learners who have Unopened/Opened/Completed the course |
Dashboard |
|
Course Completions by Month (chart) |
Number of learner course completions grouped by date (latest course completion per learner) |
Dashboard |
|
Lesson Table Data |
||
|
Lesson Id |
Unique identifier for a lesson |
Export |
|
Title |
The title of the lesson |
Both |
|
Enrolled |
The number of learners who are currently enrolled in the lesson |
Both |
|
Opens |
The number of learners who have opened the lesson |
Both |
|
Completions |
The number of learners who have completed the lesson |
Both |
|
Opened |
The percentage of learners who have opened the lesson |
Both |
|
Avg Score |
The average of the best score achieved per learner for the lesson |
Both |
|
Unopened |
Percentage of assigned users who have not opened the lesson |
Both |
|
Avg Time Spent |
The average time spent in minutes across all learner attempts for the lesson |
Both |
|
Avg Completions |
The average number of successful lesson attempts per learner |
Both |
|
Completed |
The percentage of learners who have completed the lesson |
Both |
| Clicking on a Lesson brings you to a User Level Detail view for that Lesson | ||
| Users Enrolled Data (Lesson) | ||
|
User |
The learner the record belongs to |
Both |
|
Status |
The status of the lesson (Opened, Unopened, or Complete) |
Both |
|
Time Spent |
The total time spent by the learner in the lesson |
Both |
|
Completions |
The number of times the learner has successfully completed the lesson |
Both |
|
Date Completed |
The date the lesson was first completed |
Both |
|
Best Score |
Out of all lesson attempts, the best score achieved by the learner |
Both |
|
Attempts |
The total number of successful and unsuccessful attempts at the lesson by the learner |
Both |
| Clicking on a User's Lesson record brings you to an Attempt detail table | ||
| Attempts Data | ||
|
Total Attempts |
The total number of attempts the learner has made for the lesson |
Both |
|
Successful Attempts |
The total number of times the learner has successfully completed the lesson |
Both |
|
Unsuccessful Attempts |
The total number of times the learner has attempted but not successfully completed the lesson |
Both |
|
Date Attempted |
The date of the lesson attempt |
Both |
|
Course |
The name of the course the lesson belongs to |
Both |
|
Lesson |
The lesson the attempt record applies to |
Both |
|
Training Mode |
Individual or Group |
Both |
|
Score |
The score the learner received in the attempt |
Both |
|
Result |
The result of the attempt (successful or unsuccessful) |
Both |
| Slide Table Data * | ||
|
Slide Id |
Unique identifier for a slide within a lesson |
Export |
|
Slide Title |
The heading or question for the relevant slide |
Both |
|
Lesson Id |
Unique identifier for the lesson that the slide belongs to |
Export |
|
Lesson Title |
The title of the lesson that the slide belongs to |
Both |
|
Slide Type |
The type of the slide (more info) |
Both |
|
Avg Time Spent |
Average number of seconds spent by currently enrolled learners on the slide |
Both |
|
Avg Attempts |
Average number of times the slide is attempted by currently enrolled learners |
Both |
|
Avg Correct |
Percentage of all currently enrolled learner slide attempts that are correct |
Both |
|
Clicking on a slide brings you to a user detail view for that slide (see User tab detail below) |
||
|
Users Enrolled (Slide) |
||
|
User Id |
Unique identifier for a learner |
Export |
|
Course Id |
Unique identifier for a course |
Export |
|
User |
Full name if available otherwise user name |
Both |
|
User Name |
User name of the learner |
Both |
|
Full Name |
First name and last name of the learner, separated with a space character |
Both |
|
User Groups |
User groups the learner is directly a member of |
Both |
|
Training Mode |
Indicates whether the course was completed individually or via Group Training |
Export |
|
Completed |
Most recent course completion date for the learner |
Both |
|
In Progress |
Percentage of mandatory lessons completed in the course by the learner |
Both |
|
Time Spent Minutes |
Total number of minutes spent in the course by the learner. Calculated as the sum of all SlideViewed events |
Both |
|
Score |
Calculated as the sum of the max learner lesson score per scoring lesson, divided by the number of scoring lessons |
Both |
|
Status (filter) |
Complete if the learner has completed the course and Incomplete if it is not |
|
|
Training Mode (filter) |
Individual if the learner has completed the course via the Learners App and Group if it was completed via Group Training |
|
|
User Name (filter) |
Filters learners based on their user name (not always the same as the User field displayed in the table) |
Both |
|
User Group (filter) |
Filters learners in the user group (includes parent and child user group collections/user groups) |
Both |
|
User Groups Enrolled |
||
|
User Group |
The name of the user group |
Both |
|
Parents |
The user group names of the direct parents of this user group, separated by a comma. A dash is displayed if the user group has no direct parents |
Both |
| Avg Progress |
The average course progress by learners who are a member of the user group |
Both |
| Avg Score |
The average course score achieved by learners who are a member of the user group and have completed the course |
Both |
| Avg Time Spent |
Average minutes spent in the course by learners who are a member of the user group and have completed at least 1 mandatory lesson |
Both |
| Enrolled |
The number of learners that are a member of the user group |
Both |
| Unopened |
The percentage of learners that are a member of the user group and have not opened the course |
Both |
| Completed |
The percentage of learners that are a member of the user group and have completed the course |
Both |
| User Group (filter) |
Filters user groups based on the user group name |
|
Groups Tab Data Points
Group performance data with the ability to see data of courses assigned to a group.
- Average Score of the completed in that user group in a given period
- Active Users: Amount of users that have logged in at least once that month
User Group Tab
| Columns | Definition | Availability |
| User Group Id | The unique ID for the user group | Export |
| User Group | The name you gave the user group | Both |
| Parent | This user group will be nested in a user group collection | Both |
| Avg Score | The average score of the courses based on the users that have completed the course | Both |
| Courses | Number of published courses assigned to that user group | Both |
| Inactive | The percentage of users in that user group that have not logged in the past 30 days | Both |
| Subgroups | The number of user groups nestled in the Parent Group the user group is a part of | Both |
| Users | How many users are assigned to the user group | Both |
| Completion |
Of the courses assigned to the user group, the percentage that has been completed. *Completion for all user groups will be courses that are on universal access only. |
Both |
Parent Tab
| Columns | Definition | Availability |
| User Group | The name you gave the user group nested in the Parent Group | Both |
| Parent | The name of the user group collection | Both |
| Subgroup | The number of user groups nestled in the Parent Group | Both |
| Courses | The number of published courses assigned to the user group | Both |
| Users | The number of users inside the user group | Both |
| Recently Active | The number of recently active users belonging to that user group | Both |
| Avg Score | The average score of the courses based on the users that have completed the course | Both |
| Avg Progress | The average course progress of users in that user group | Both |
| Avg Time Spent | The average time spent by users in that user group for the courses they are assigned to | Both |
| Completion |
Of the courses assigned to the user group, the percentage that has been completed. *Completion for all user groups will be courses that are on universal access only. |
Both |
Users Tab Data Points
See data for individuals. Clicking on a user and then a course will show lesson data for that user and course.
- Total App Visits of all users in a given period
- Total Time Spent in Lessons of all users given a period
- Average Score of the completed in that user group in a given period
- Active Users: Amount of users that have logged in at least once that month
- Click on any individual User, then select an assigned course to see level Lesson Level Data Points.
| Columns | Definition | Availability |
| User Id | The unique ID for the user | Export |
| User | The full name of the user. If not provided, defaults to username | Both |
| Username | Export | |
| Full Name | First and last name. If not provided, is blank. | Export |
| Usergroup List | All the user groups that the user is assigned to | Both |
| Courses | Number of published courses assigned to that user group | Both |
| Avg Progress |
The overall rate of lessons that have been completed out of those assigned
|
Both |
| Avg Score | The average score of the courses based on the users that have completed the course | Both |
| Overdue | If a course has a due date set, the amount of courses that have past that due date | Both |
| Is Active | If the user has logged in the past 30 days | Both |
| User Visits in the Last 30 days | Exports | |
| Completed | Of the courses assigned to the user, the percentage that has been completed | Both |
| Lesson Table Data | ||
|
Title |
The name you gave the Lesson |
Both |
|
Avg Score |
The average score across user attempts |
Both |
|
Unopened |
Percentage of assigned users who have not opened the lesson |
Both |
|
Avg Time Spent |
Average number of minutes spent in the lesson |
Both |
|
Avg Completions |
The average number of successful completions |
Both |
|
Completed |
Percentage of assigned users who have completed the lesson |
Both |
| Clicking on a lesson shows the lesson detail table. See above under the Courses Tab for info | ||
| Slide Table Data * | ||
|
Slide Title |
The heading or question for the relevant slide |
Both |
|
Slide Type |
Multiple choice, concepts, relationships, and number slides are included in our slide-level analytics. Game slides are not included. |
Both |
|
Lesson Title |
The name of the lesson the slide belongs to |
Both |
|
Time Spent |
How long the learner spend on the slide |
Both |
|
First Attempt |
The result of the learner's first attempt of the slide, either Correct or Incorrect |
Both |
|
Latest Attempt |
The result of the learner's latest attempt at the slide, either Correct or Incorrect |
Both |
|
Attempts |
The number of times the learner has attempted the slide. Hovering over the column shows further attempt detail: Attempt answer: The answer the learner gave on the slide Attempt at: The time the answer was recorded |
Both |
* Further Information on Slide Level data:
- Shows attempts recorded after December 2021
- Only shows slides where activity has occurred