As an Admin, it's easy to view multiple data points through EdApp's Analytics suite directly on the LMS. Sometimes, you might want to generate a custom report which pulls together multiple data points into a spreadsheet that you can share further within your organisation.
This post covers how to manually pull together this data into two of the most popular reporting formats.
Building a report on user registration
Create a report with any of these parameters:
- Users
- User groups
- Date registered
- Date last logged in
- Total visits
- App version and Operating System version
- Lessons completed
Analytics page: Login Statistics by User
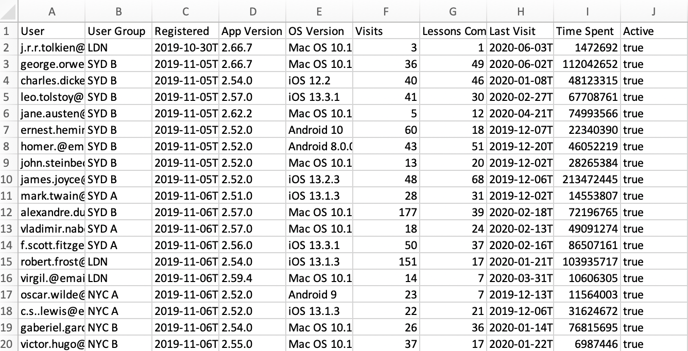
After exporting the file (either CSV or XLSX), open it with your preferred spreadsheet application (like Excel or Numbers). It will look something like this:
Delete any columns you don't need.
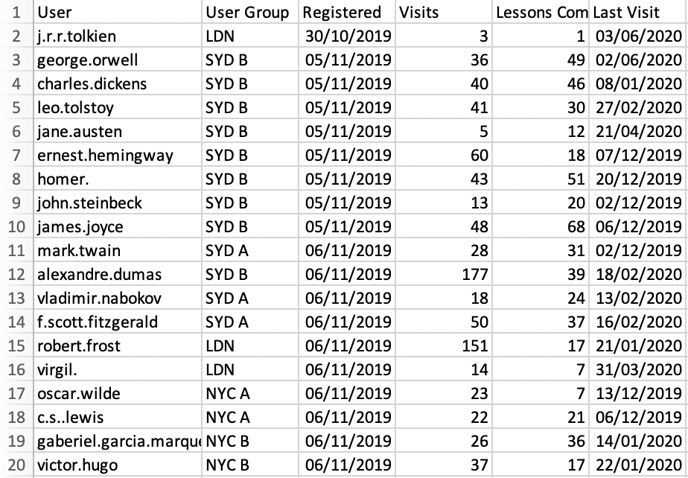
Remove any additional data (such as email endings and surplus data in the Registered and Last Visit columns.) You can do this by creating new columns and utilising the Text to Columns feature (entering @ to remove email endings and T for surplus data in the date columns.) Remove this extra data from the sheet and copy the simplified data back to the original columns. Your cleaned up spreadsheet will look something like this:
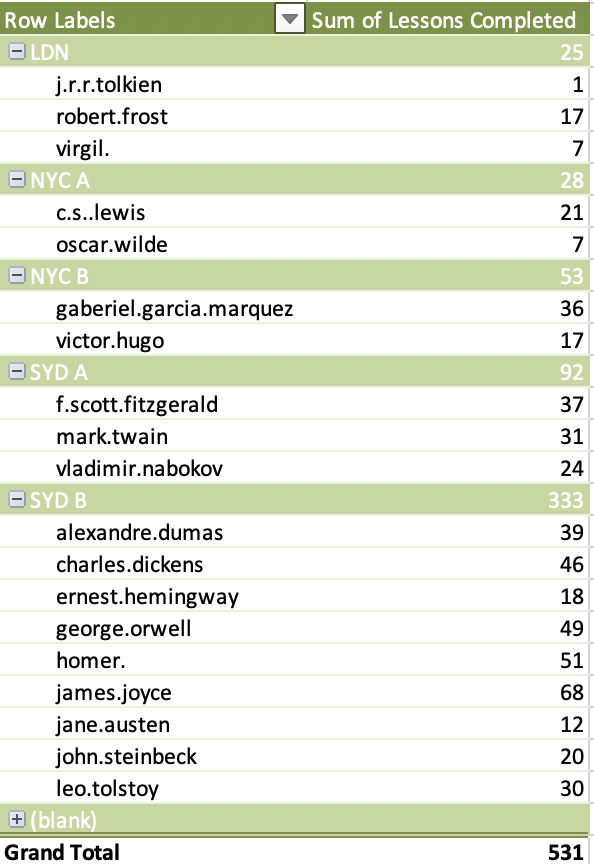
Consider using filters or pivot tables to further organise your data. You could sort by date registered or date last visited for example. You could also utilise a pivot table to segment the data by user group or other parameters, like the example below.
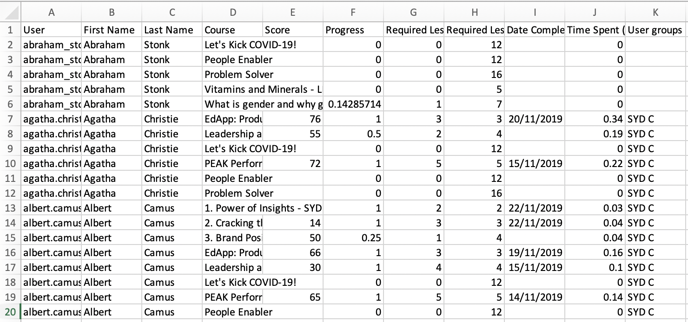
Building a report on course completion
Create a report with any of these parameters:
- Users
- User groups
- Course
- Progress
- Score
- Date Completed
Analytics page: Course Completion by User
After exporting the file (CSV file), open it with your preferred spreadsheet application (like Excel or Numbers). It will look something like this:
Delete any columns you don't need.
Remove any additional data (such as email endings.) You can do this by creating new columns and utilising the Text to Columns feature (entering @ to remove email endings.) Remove this extra data from the sheet and copy the simplified data back to the original columns. Your cleaned up spreadsheet will look something like this:
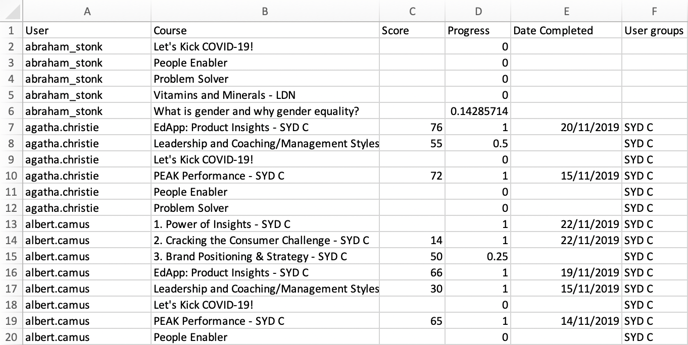
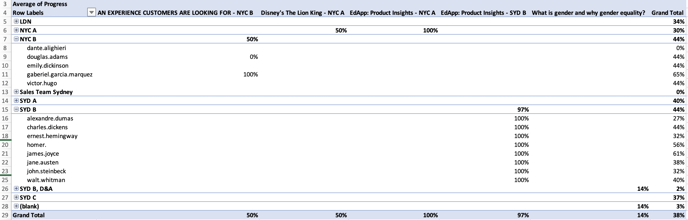
If you're reporting on Score and Progress, consider changing the formatting so that they reflect as a percentage.
If you're looking to report on progress across a specific course or user group, consider using filters or pivot tables to further organise your data, like the example below: