Available on EdApp Paid Plans
Contents
- Types of Manager Reports
- Enablement
- Data Points
- Advanced and Flexible Filtering on the Manager's Dashboard
There are three reports available for Managers
Manager Performance Dashboard is a subset of analytics from the Performance Dashboard. This allows managers to check aggregated data for a user group assigned to them.
Course completion by User is a subset of analytics for a user group assigned to them. It shows detailed user/course performance information.
Enablement
- Go to the 'Users' page on the 'Users' tab
- Select the user you would like to have access to the manager dashboard
- Click on the 'roles' > 'assign roles'

- Tick 'Manager Analytics'

5. Select 'user groups' > 'manager' > 'assign managed user groups'
6. Select your groups as save.
Users must have the manager role and be assigned a user group to see the reports (if they aren't assigned the role, or a user group to manage, they won't be able to log in).
You can send these instructions to your manager on how to log in.
It takes approximately 2 hours for data to update.
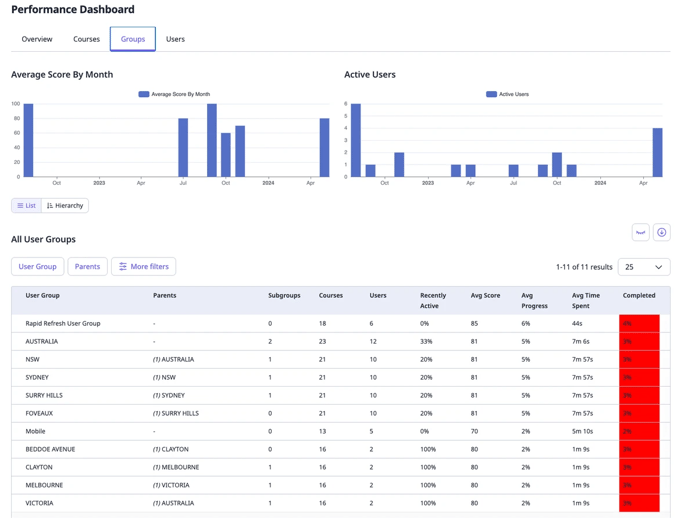
Data Points
The Manager’s assigned user groups can be listed in a hierarchy format
Click on a user group to see specific users in that group
Managers can access the results for all learners within their hierarchy, irrespective of the course assignment method.

Data points that give an overview relative to the group selected
-
Number of users
-
Number of courses published
-
Average score
-
Average Completion
- Export data to access raw data of the preferred table.
![]()
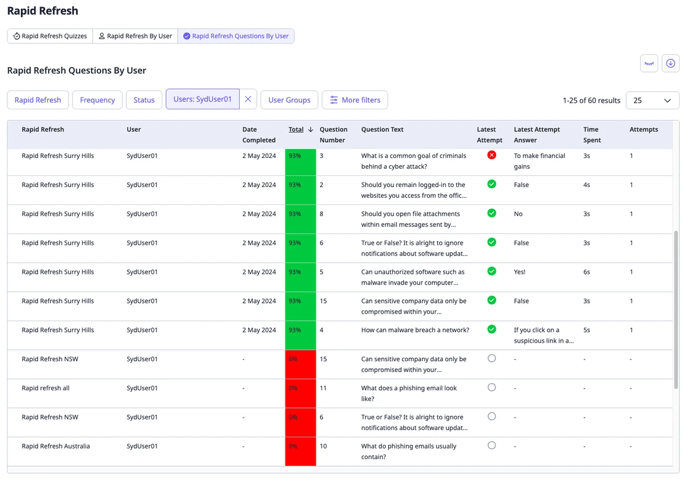
These three tabs show aggregated data relative to the group.
Users: Click on a username to show course completion for courses assigned to the user

Course: Click on a course tab to show user completion details for that course

Advanced and Flexible Filtering on the Manager's Dashboard
"Mandatory" and "Optional/Not Mandatory" course filters - This allows managers to better track the overall progress of the user groups they manage in completing mandatory courseware.
The Mandatory filter is available on the User Group and Courses Tabs.

Assignment filter - This defines what courses should be included in metric calculations based on the user group assignment method. For example, this allows managers to exclude universally assigned courses from aggregate scores. The Assignment filter is available on the User Group tab and it includes 3 options:
-
- Exclude Universally assigned - excludes when the course is assigned to all users.
-
- Exclude parents - excludes courses assigned to parent groups/sites.
-
- Exclude children - excludes courses assigned to child groups/sites.
